class: left, bottom, inverse, title-slide # Bayesian Statistics ## Lecture 10: Review ### Yanfei Kang ### 2019/11/20 (updated: 2019-12-10) --- # What have we learnt? - Basic Bayesian inference. - Basic Bayesian computation. - MC and MCMC. - Bayesian modelling. --- # Basic Bayesian inference - We started from Bayes' Rule `\(P(A|B) = \frac{P(A \& B)}{P(B)}\)`. - The HIV diagnostic testing example leads us to Bayesian updating, which refers to going from the **prior** to the **posterior**. - Bayesian inference via Bayes' Rule `\(P(\theta|\text{data}) = \frac{P(\text{data}| \theta)P(\theta))}{P(\text{data})}\)`. - We used different types of priors in the inference about the proportion `\(p\)` of college students get at least eight hours of sleep. --- # Bayesian inference of the proportion `\(p\)` - Prior: `\(g(p)\)`. - Data: `\(s\)` sucesses and `\(f\)` failures. - Likelihood: `\(L(p) \propto p^{s}(1-p)^{f}, 0<p<1.\)`. - According to the Bayes' Rule: `\(g(p|\text{data}) \propto g(p)L(p).\)` --- # Lab 1 In this example, 11 of 27 students sleep a sufficient number of hours. Make Bayesian inference of `\(p\)` based on discrete prior. ```r pdisc <- function(pr, p, s, f, plot.it = TRUE) { like <- p^s * (1 - p)^f # calculate likelihood post <- pr * like post <- post/sum(post) # calculate posterior if (plot.it) { par(mfrow = c(2, 1)) plot(p, pr, type = "h", lty = 2, ylim = c(0, 1), ylab = "prior") plot(p, post, type = "h", lty = 1, ylim = c(0, 1), ylab = "posterior") } # plot prior/posterior probability result <- list(prior = pr, likelihood = like, posterior = post) return(result) } ``` --- # Lab 1 .pull-left[ ```r # Bayesian inference p = seq(0.05, 0.95, by = 0.1) prior = c(1, 5.2, 8, 7.2, 4.6, 2.1, 0.7, 0.1, 0, 0) prior = prior/sum(prior) pdisc(prior, p, 11, 16) ``` ] .pull-right[ <!-- --> ``` ## $prior ## [1] 0.034602076 0.179930796 0.276816609 0.249134948 0.159169550 ## [6] 0.072664360 0.024221453 0.003460208 0.000000000 0.000000000 ## ## $likelihood ## [1] 2.149056e-15 6.422538e-11 2.389573e-09 9.803072e-09 1.074337e-08 ## [6] 3.939035e-09 4.437472e-10 9.833634e-12 1.099179e-14 8.679201e-22 ## ## $posterior ## [1] 1.451714e-08 2.256022e-03 1.291349e-01 4.767910e-01 3.338350e-01 ## [6] 5.587820e-02 2.098297e-03 6.642742e-06 0.000000e+00 0.000000e+00 ``` ] --- # Single parameter models - We looked at the Bayesian Inference for the Cancer Death Rate. - Assume `\(y_j \sim \text{Poisson}(10n\theta_j)\)`. - Prior: `\(\theta_j \sim \text{Beta}(\alpha, \beta)\)`. - Posterior: `\(\theta_j|y_j \sim \text{Beta}(\alpha + y_j, \beta + 10n_j)\)`. --- # Lab 2.1 In theory, what is the predictive distribution of `\(y\)`? Since `$$p(y)=\frac{p(y | \theta) p(\theta)}{p(\theta | y)},$$` we have `$$\begin{aligned} p(y_j) & = \frac{\frac{\left(10 n_j \theta_{j}\right)^{y_{j}} e^{-10 n_{j} \theta_{j}}}{y_{j} !} \frac{\beta^{\alpha}}{\Gamma(\alpha)} \theta_{j}^{\alpha-1} e^{-\beta \theta_{j}}}{\frac{\left(\beta+10 n_{j}\right)^{\alpha+y_{j}}}{\Gamma\left(\alpha+y_{j}\right)} \theta_{j}^{\alpha+y_{j}-1} e^{-\left(\beta+10 n_{j}\right) \theta_{j}}} \\ &= \frac{\Gamma\left(\alpha+y_{j}\right) 10 n_{j}^{y_{j}} \beta^{\alpha}}{\Gamma(\alpha) y_{j} !\left(\beta+10 n_{j}\right)^{\alpha+y_{j}}} \sim\text{Neg-Bin}(\alpha, \beta/10n_j) \end{aligned}$$` --- # Lab 2.2 Simulate from the predictive distribution of `\(y\)`. .pull-left[ ```r sim_pre_dis <- function(p_alpha, p_beta, n) { # simulate theta thetas <- rbeta(1000, p_alpha, p_beta) y <- c() for (theta in thetas) { # simulate y for every theta ys <- rpois(1000, 10 * n * theta) y <- c(y, ys) } return(y) } y <- sim_pre_dis(21, 440000, 1000) hist(y) ``` ] .pull-right[ <!-- --> ] --- # Multi-parameter models - Normal data with both parameters unknown. - Prior: `\(g\left(\mu, \sigma^{2}\right) \propto 1 / \sigma^{2}.\)` - Posterior: `$$\begin{aligned} g\left(\mu, \sigma^{2} | y\right) & \propto \sigma^{-n-2} \exp \left(-\frac{1}{2 \sigma^{2}} \sum_{i=1}^{n}\left(y_{i}-\mu\right)^{2}\right) \\ &=\sigma^{-n-2} \exp \left(-\frac{1}{2 \sigma^{2}}\left[\sum_{i=1}^{n}\left(y_{i}-\overline{y}\right)^{2}+n(\overline{y}-\mu)^{2}\right]\right) \\ &=\sigma^{-n-2} \exp \left(-\frac{1}{2 \sigma^{2}}\left[(n-1) s^{2}+n(\overline{y}-\mu)^{2}\right]\right) \end{aligned},$$` - This can be factorized as the product of conditional and marginal posterior densities. --- # Multi-parameter models ### Conditional posterior `$$\mu | \sigma^{2}, y \sim \mathrm{N}\left(\overline{y}, \sigma^{2} / n\right).$$` ### Marginal posterior `$$\begin{aligned} p\left(\sigma^{2} | y\right) & \propto \sigma^{-n-2} \exp \left(-\frac{1}{2 \sigma^{2}}(n-1) s^{2}\right) \sqrt{2 \pi \sigma^{2} / n} \\ & \propto\left(\sigma^{2}\right)^{-(n+1) / 2} \exp \left(-\frac{(n-1) s^{2}}{2 \sigma^{2}}\right) \end{aligned},$$` which is a scaled inverse- `\(\chi^2\)` density: `\(\sigma^{2} | y \sim \text{Inv-} \chi^2(n-1, s^2).\)` --- # Sampling from the joint posterior distribution 1. First draw `\(\sigma^2\)` from the marginal posterior distribution. 2. Draw `\(\mu\)` from the conditional posterior distribution. **We can also use grid approximation to summarize the posterior**, but when we have more parameters we need **Bayesian Computing**. --- # Introduction to Bayesian Computing - Bear in mind that given the prior and data, the posterior is fixed and a Bayesian analysis really boils down to **summarizing the posterior**. - Approaches to Bayesian Computing - Just use a point estimate: Maximum a Posteriori (MAP) estimate. - Approximate the posterior as Gaussian. - Numerical integration. - Markov Chain Monte Carlo (MCMC) sampling. --- # Lab 3 Say `\(Y|\theta \sim \text{Poisson}(N\theta),\)` and `\(\theta \sim \text{Gamma}(a, b)\)`, find `\(\hat{\theta}_{MAP}\)`. ### Posterior `$$\begin{aligned} P(\theta | Y) &\propto P(Y | \theta) \cdot P(\theta)\\&= \frac{(N \theta)^{\sum y} e^{-N \theta}}{\Pi y !} \times \frac{b^{a} \theta^{a-1} e^{-b \theta}}{\Gamma(a)} \\&=\theta^{(\Sigma y)+a-1} e^{-N \theta} \cdot \frac{N^{y} b^{a} e^{b \theta}}{\Pi y ! \Gamma(a)}\\&=\theta^{\left(\sum y\right)+a-1} e^{-(N+b) \theta} \frac{N^{y} b^{a}}{\Pi y ! \Gamma(a)} \\ & \propto \theta^{\left(\sum y\right)+a-1} e^{-(N+b) \theta} \end{aligned}$$` --- # Lab 3 - MAP: `\(\hat{\boldsymbol{\theta}}=\underset{\boldsymbol{\theta}}{\operatorname{argmax}} p(\boldsymbol{\theta} | \mathbf{Y})\)`. - For this question, by optimization, we have `\(\hat{\theta}_{MAP}=\frac{\sum y+a-1}{N+b}.\)` - Remember that you can also use `optim` function in **R**. --- # Bayesian CLT - For large `\(n\)`, `$$\boldsymbol{\theta} \sim \operatorname{Normal}\left[\hat{\boldsymbol{\theta}}_{M A P}, \mathbf{I}\left(\hat{\boldsymbol{\theta}}_{M A P}\right)^{-1}\right].$$` - The `\((j, k)\)`-th element of `\(\mathbf{I}\)` is `\(-\frac{\partial^{2}}{\partial \theta_{j} \partial \theta_{k}} \log [p(\boldsymbol{\theta} | \mathbf{Y})],\)` evaluated at `\(\hat{\theta}_{MAP}\)`. - Then we can do everything we do for normal distribution, e.g., sd, intervals etc. --- # Strategies to summarize posterior 1. If we have familiar distributions, we can simply **simulate** samples in R. 2. **Grid approximation**. - Compute values of the posterior on a grid of points. - Approximate the continuous posterior by a discrete posterior. - Applicable for one- and two-parameter problems. 3. If there are more parameters, we consider **deterministic tools**. - MAP - Bayesian CLT - Numerical Integration 4. **Monte Carlo** methods are more general. - Independent Monte Carlo - Markov Chain Monte Carlo --- # Independent Monte Carlo: Direct sampling - For any continuous r.v. `\(X\)`, `\(F_{X}(X) \sim U(0,1)\)`. **Why?** - Suppose that we are given `\(U \sim U(0,1)\)` and want to simulate a continuous r.v. `\(X\)` with cdf `\(F_X\)`. Put `\(Y = F_{X}^{-1}(U)\)`, we have `$$F_{Y}(y)=\mathbb{P}(Y \leq y)=\mathbb{P}\left(F_{X}^{-1}(U) \leq y\right)=\mathbb{P}\left(U \leq F_{X}(y)\right)=F_{X}(y).$$` --- # Independent Monte Carlo: Rejection sampling - Although we cannot easily sample from `\(f(\theta|y)\)`, there exists another density `\(g(\theta)\)` (called *proposal* density), like a Normal distribution or perhaps a `\(t\)`-distribution, from which it is easy for us to sample. - Then we can sample from `\(g(\theta)\)` directly and then "reject" the samples in a strategic way to make the resulting "non-rejected" samples look like they came from `\(f(\theta|y)\)`. --- # Independent Monte Carlo: Rejection sampling 1. Sample `\(U \sim \operatorname{Unif}(0,1)\)`. 2. Sample `\(\theta\)` at random from the probability density proportional to `\(g(\theta)\)`. 3. If `\(U \leq \frac{f(\theta|y)}{M g(\theta)}\)`, accept `\(\theta\)` as a draw from `\(f\)`. If the drawn `\(\theta\)` is rejected, return to step 1. (With probability `\(\frac{f(\theta | y)}{M g(\theta)}\)`), accept `\(\theta\)`). The algorithm can be repeated until the desired number of samples from the target density `\(f\)` has been accepted. --- # Lab 4 Use the rejection sampling algorithm to simulate from `\(N(0, 1)\)`. Try the following proposal densities. 1. Logistic Distribution. 2. Cauchy distribution. 3. Student `\(t_5\)` distribution. 4. `\(N(1,2)\)` distribution. For each proposal record the percentage of iterates that are accepted. Which is the best proposal? --- # Lab 4 .pull-left[ ```r curve(dnorm(x), -6, 6, xlab="x", ylab = "Density", n=200) curve(dlogis(x), -6, 6,add=TRUE, col=2, n=200) curve(dcauchy(x), -6, 6, add=TRUE, col=3, n=200) curve(dt(x, df=5), -6, 6, add=TRUE, col=4, n=200) curve(dnorm(x, 1, 2), -6, 6, add=TRUE, col=5, n=200) legend("topright", c("N(0,1)", "logistic", "cauchy", "t(5)", "N(1,2)"), col=1:5, bty="n", lty=1) ``` ] .pull-right[ <!-- --> ] --- # Lab 4 ```r dist_ratio <- function(x, dist_a, dist_b, ...) { return(dist_a(x) / dist_b(x, ...)) } 1 / optimise(dist_ratio, c(-2,2), dnorm, dlogis, maximum=TRUE)$objective ``` ``` ## [1] 0.6266571 ``` ```r 1 / optimise(dist_ratio, c(-2,2), dnorm, dcauchy, maximum=TRUE)$objective ``` ``` ## [1] 0.6577446 ``` ```r 1 / optimise(dist_ratio, c(-2,2), dnorm, dt, df=5, maximum=TRUE)$objective ``` ``` ## [1] 0.9078776 ``` ```r 1 / optimise(dist_ratio, c(-3,3), dnorm, dnorm, mean=1, sd=2, maximum=TRUE)$objective ``` ``` ## [1] 0.4232409 ``` --- # Independent Monte Carlo: Importance sampling - We can rewrite the target `$$\mathbb{E}_{f}[h(\theta|y)]=\mathbb{E}_{g}\left[\frac{f(\theta|y)}{g(\theta)} h(\theta|y)\right].$$` - If `\(\theta_{1}, \dots, \theta_{n} \sim g\)`, we get `$$\tilde{\mu}_{n}=\frac{1}{n} \sum_{i=1}^{n} \frac{f\left(\theta_{i}|y\right)}{g\left(\theta_{i}\right)} h\left(\theta_{i}|y\right)=\frac{1}{n} \sum_{i=1}^{n} w_{i} h\left(\theta_{i}|y\right) \approx \mathbb{E}_{f}[h(\theta|y)].$$` - `\(w_i\)` are referred to as the importance weights. --- # Limitations of independent Monte Carlo methods - The ability to sample from the posterior distribution is essential to the practice of Bayesian statistics. - Direct sampling - Sometimes difficult to find the inverse function. - Rejection sampling and importance sampling - Doesn’t work well if proposal is very different from the target. - Yet constructing a proposal similar to the target can be difficult. - Intuition of MCMC - Instead of a fixed proposal, use an adaptive proposal. --- # The key to MCMC's success - Not the Markov property. - But the approximate distributions are improved at each step in simulation (in the sense of converging to the target distribution). --- # Metropolis To make sure this Markov chain converges to our target, we need to include the following. 1. At step `\(i+1\)`, set `\(x^{[\mathrm{old}]} = x^{[i]}\)`. 2. Generate `\(x^{[\mathrm{new}]} \sim N\left(x^{[\mathrm{old}]}, 1\right)\)`, and compute `$$\alpha=\min \left(1, \frac{p\left(x^{[\mathrm{new}]}\right)}{p\left(x^{[\mathrm{old}]}\right)}\right).$$` 3. Set `\(x^{[i+1]} = x^{[\mathrm{new}]}\)` with probability `\(\alpha\)` (accept); set `\(x^{[i+1]} = x^{[\mathrm{old}]}\)` with probability `\(1-\alpha\)` (reject). --- # Example .pull-left[ Here is a target distribution to sample from. It’s the weighted sum of two normal distributions. Sample using the Metropolis algorithm, and plot the trace. ```r p <- 0.4 mu <- c(-1, 2) sd <- c(0.5, 2) f <- function(x) { p * dnorm(x, mu[1], sd[1]) + (1 - p) * dnorm(x, mu[2], sd[2]) } curve(f(x), -4, 8, n = 301, las = 1) ``` ] .pull-right[ <!-- --> ] --- # ### Define `\(q\)` ```r q <- function(x) rnorm(1, x, 4) ``` ### Define the step ```r step <- function(x, f, q) { ## Pick new point xp <- q(x) ## Acceptance probability: alpha <- min(1, f(xp) / f(x)) ## Accept new point with probability alpha: if (runif(1) < alpha) x <- xp ## Returning the point: x } ``` --- # Let's run it ```r run <- function(x, f, q, nsteps) { res <- matrix(NA, nsteps, length(x)) for (i in seq_len(nsteps)) res[i,] <- x <- step(x, f, q) return(res) } res <- run(-10, f, q, 1100) ``` --- # Trace plot (1100 samples, with the first 100 burn-in) <img src="BS-L10-review_files/figure-html/unnamed-chunk-10-1.png" style="display: block; margin: auto;" /> --- # Does it resembles our target? .pull-left[ ```r hist(res[101:1100], 50, freq=FALSE, main="", ylim=c(0, .4), las=1, xlab="x", ylab="Probability density") z <- integrate(f, -Inf, Inf)$value curve(f(x) / z, add=TRUE, col="red", n=200) ``` ] .pull-right[ <!-- --> ] --- # Lab 5 1. Try 10000 samples. 2. Try different initial values (even very unrealistic ones). 3. Try different values of standard deviation for `\(q\)` (e.g., 50, 0.1). Plot their trace plots together with the previous one. Calculate their acceptance rates. Your findings? 4. Based on 3, plot the autocorrelation plots of the three traces. Your findings? --- # Lab5 .pull-left[ ```r res.long <- run(-10, f, q, 50000) hist(res.long, 100, freq=FALSE, main="", ylim=c(0, .4), las=1, xlab="x", ylab="Probability density", col="grey") z <- integrate(f, -Inf, Inf)$value curve(f(x) / z, add=TRUE, col="red", n=200) ``` ] .pull-right[ <!-- --> ] --- # Lab5 .pull-left[ ```r res.fast <- run(-10, f, function(x) rnorm(1, x, 50), 1000) res.slow <- run(-10, f, function(x) rnorm(1, x, .1), 1000) layout(matrix(c(1, 2), 1, 2), widths=c(4, 1)) par(mar=c(4.1, .5, .5, .5), oma=c(0, 4.1, 0, 0)) plot(res, type="s", xpd=NA, ylab="Parameter", xlab="Sample", las=1, col="grey") lines(res.fast, col="red") lines(res.slow, col="blue") plot(f(xx), xx, type="l", yaxs="i", axes=FALSE) ``` ] .pull-right[ <!-- --> ] --- # Lab5 .pull-left[ ```r par(mfrow=c(3, 1), mar=c(4, 2, 3.5, .5)) acf(res.slow, las=1, main="Small steps") acf(res, las=1, main="Intermediate") acf(res.fast, las=1, main="Large steps") ``` ] .pull-right[ <!-- --> ] --- # Lab5 ```r coda::effectiveSize(res) ``` ``` ## var1 ## 173.5628 ``` ```r coda::effectiveSize(res.fast) ``` ``` ## var1 ## 31.53674 ``` ```r coda::effectiveSize(res.slow) ``` ``` ## var1 ## 1.823605 ``` --- # Metropolis-Hastings 1. At step `\(i+1\)`, set `\(x^{[\mathrm{old}]} = x^{[i]}\)`. 2. Simulate `\(x^{[\mathrm{new}]}\)` from the proposal density `\(q\left(x^{[\mathrm{new}]}|x^{[\mathrm{old}]}\right)\)`, and compute `$$\alpha=\min \left(1, \frac{p\left(x^{[\mathrm{new}]}\right) q\left(x^{[\mathrm{old}]}|x^{[\mathrm{new}]}\right)}{p\left(x^{[\mathrm{old}]}\right) q\left(x^{[\mathrm{new}]}|x^{[\mathrm{old}]}\right)}\right).$$` 3. Set `\(x^{[i+1]} = x^{[\mathrm{new}]}\)` with probability `\(\alpha\)` (accept); set `\(x^{[i+1]} = x^{[\mathrm{old}]}\)` with probability `\(1-\alpha\)` (reject). --- # Gibbs sampler - This gives the Gibbs Sampler. If our current state is `\((x^{[i]}, z^{[i]})\)`, then we update our parameter values with the following steps. 1. Generate `\(x^{[i+1]} \sim p\left(x|z^{[i]}\right).\)` 2. Generate `\(z^{[i+1]} \sim p\left(z|x^{[i+1]}\right).\)` - `\(x\)` and `\(z\)` can be swapped around. - It works for more than two variables (think about the case with three parameters). - Always make sure the conditioning variables are at the most recent state. --- # Lab 6 Simulate using Gibbs sampler from a bivariate Normal distribution with mean `\((\mu_1, \mu_2)\)` and known variance matrix `\(\Sigma=\left(\begin{array}{cc}{\sigma_{1}^{2}} & {\rho} \\ {\rho} & {\sigma_{2}^{2}}\end{array}\right)\)`, and plot the sample traces. --- # Lab 6 ```r gibbs <- function(n, mu1, s1, mu2, s2, rho) { mat <- matrix(ncol = 2, nrow = n) x <- 0 y <- 0 mat[1, ] <- c(x, y) for (i in 2:n) { x <- rnorm(1, mu1 + (s1/s2) * rho * (y - mu2), sqrt((1 - rho^2) * s1^2)) y <- rnorm(1, mu2 + (s2/s1) * rho * (x - mu1), sqrt((1 - rho^2) * s2^2)) mat[i, ] <- c(x, y) } mat } gibbs_sim1 <- gibbs(1000, 1, 0.5, 2, 8, 0.4) ``` --- # Bayesian linear regression - Recall the linear regression model `$$y_i = \beta_0 + \beta_1 x_1 + ... + \beta_p x_p + \epsilon_i,$$` where `\(\epsilon_i \sim N(0, \sigma^2).\)` - We are intertested in the joint distribution of `\(\beta_0,\beta_1,...\beta_p\)` and `\(\sigma^2\)`. - You know how to get that by OLS under the Gaussian assumption. We have `\(\beta|\sigma^2 \sim N\left[(x'x)^{-1}x'y,(x'x)^{-1}\sigma^2\right]\)` and `\(\sigma^2 \sim \chi^2(n-p)\)`. --- # The Bayesian approach - We know by the Bayes' rule `$$\begin{aligned} p\left(\beta, \sigma^{2} | y, x\right) & \propto p\left(y | \beta, \sigma^{2}, x\right) p\left(\beta, \sigma^{2}\right) \\ &=p\left(y | \beta, \sigma^{2}, x\right) p\left(\beta | \sigma^{2}\right) p\left(\sigma^{2}\right) \end{aligned}$$` where `\(p(y|\beta,\sigma^2,x)\)` is the **likelihood** for the model and `\(p(\beta,\sigma^2) = p(\beta|\sigma^2)p(\sigma^2)\)` is the **prior** information of the parameters and `\(p(\beta,\sigma^2|y,x)\)` is called the **posterior**. - **The Bayesian way**: Let's just draw random samples from `\(p(\beta,\sigma^2|y,x)\)`. --- # Sampling the Posterior - Write down the likelihood function. - Specify the prior. - Write down the posterior. - Use Gibbs to draw. Set a initial value for `\(\beta^{(0)}\)` and `\(\sigma^{2(0)}\)`. - Draw a random vector `\(\beta^{(1)}\)` from `\(p(\beta^{(1)} | \sigma^{2(0)},y,x)\)` - Draw a random number `\(\sigma^{2(1)}\)` from `\(p(\sigma^{2(1)}| \beta^{(1)} ,y,x)\)` - Draw a random vector `\(\beta^{(2)}\)` from `\(p(\beta^{(2)} | \sigma^{2(1)},y,x)\)` - Draw a random number `\(\sigma^{2(2)}\)` from `\(p(\sigma^{2(2)}| \beta^{(2)} ,y,x)\)` - Draw a random vector `\(\beta^{(3)}\)` from `\(p(\beta^{(3)} | \sigma^{2(2)},y,x)\)` - Draw a random number `\(\sigma^{(3)}\)` from `\(p(\sigma^{2(3)}| \beta^{(3)} ,y,x)\)` - ... - ... - Summarize `\(\beta^{(1)},\beta^{(2)},...,\beta^{(n)}\)` - Summarize `\(\sigma^{(1)},\sigma^{(2)},...,\sigma^{(n)}\)` --- # Lab 7 Work on random walk Metroplis within Gibbs for multiple linear regression. - Prior for `\(\beta\)`: `\(\beta \sim N(0, I)\)`. - Prior for `\(\sigma^2\)`: `\(\sigma^2 \sim \chi^2(10)\)`. - Write down the likelihood. - Write down the joint posterior. - Go to Gibbs. - Use random walk proposal for Metropolis. - Summary your samples. --- # Lab 7.1 ```r ## Generate data for linear regression n <- 1000 p <- 3 epsilon <- rnorm(n, 0, 0.1) beta <- matrix(c(-3, 1, 3, 5)) X <- cbind(1, matrix(runif(n * p), n)) y <- X %*% beta + epsilon ``` --- # Lab 7.1 ```r ## Log posterior library(mvtnorm) LogPosterior <- function(beta, sigma2, y, X) { p <- length(beta) ## The log likelihood function LogLikelihood <- sum(dnorm(x = y, mean = X %*% beta, sd = sqrt(sigma2), log = TRUE)) ## The priors LogPrior4beta <- dmvnorm(x = t(beta), mean = matrix(0, 1, p), sigma = diag(p), log = TRUE) LogPrior4sigma2 <- dchisq(x = sigma2, df = 10, log = TRUE) LogPrior <- LogPrior4beta + LogPrior4sigma2 ## The log posterior LogPosterior <- LogLikelihood + LogPrior return(LogPosterior) } ``` --- # Lab 7.1 ```r step <- function(x, f, q, ...) { ## Pick new point xp <- q(x) ## Acceptance probability: alpha <- min(1, exp(f(xp, ...) - f(x, ...))) ## Accept new point with probability alpha: if (runif(1) < alpha) x <- xp ## Returning the point: return(x) } ``` --- # Lab 7.1 ```r q1 <- function(x){x + rnorm(length(x), sd=0.5)} q2 <- function(x){rgamma(1, 1)} mgibbs <- function(y, X, beta.init, sigma2.init, q1, q2, f, nIter = 1000, nBurnin = nIter/10){ mean.X <- apply(X, 2, mean) X.demean <- apply(X, 2, function(x){x - mean(x)}) X <- cbind(1, X.demean) beta <- matrix(NA, nIter, ncol(X)) sigma2 <- matrix(NA, nIter, 1) beta[1, ] <- beta.init sigma2[1, ] <- sigma2.init for (i in 2:nIter) { beta[i, ] <- step(beta[i-1, ], LogPosterior, q1, sigma2=sigma2[i-1], y=y, X=X) sigma2[i, ] <- step(sigma2[i-1], LogPosterior, q2, beta=beta[i,], y=y, X=X)} beta[, 1] = beta[,1] - beta[, 2:ncol(X)] %*% as.matrix(mean.X, ncol(X) - 1, 1) return(list(beta = beta[-c(1:nBurnin), ], sigma2 = sigma2[-c(1:nBurnin)])) } ``` --- # Lab 7.1 ```r toy_mgibbs <- mgibbs(y, X[, 2:4], c(-1,2,3,4), 0.5, q1, q2, LogPosterior, 5000) apply(toy_mgibbs$beta, 2, mean) ``` ``` ## [1] -3.083617 1.070846 2.989839 5.064991 ``` --- # Lab 7.2 ```r library(BAS) data("bodyfat") X <- matrix(bodyfat$Abdomen) y <- matrix(bodyfat$Bodyfat) bodyfat.mgibbs <- mgibbs(y, X, c(-10,0.6), 0.5, q1, q2, LogPosterior, 10000) bodyfat.coef <- apply(bodyfat.mgibbs$beta, 2, mean) ``` --- # Lab 7.2 .pull-left[ ```r plot(X, y, xlab = 'Abdomen', ylab = 'Bodyfat') for (i in 1:dim(bodyfat.mgibbs$beta)[1]){ abline(a = bodyfat.mgibbs$beta[i, 1], b = bodyfat.mgibbs$beta[i, 2], col = 'lightblue') } abline(a = bodyfat.coef[1], b = bodyfat.coef[2], col = 2) legend("bottomright", c('Posteror mean', 'Posterior sample regression lines'), col = c('red', 'lightblue'), lty = 1) ``` ] .pull-right[ <!-- --> ] --- # Lab 7.2 ```r library(ggplot2) # Construct current prediction beta0 = bodyfat.coef[1]; beta1 = bodyfat.coef[2] n.newx = 100; alpha = 0.05 new_x = seq(min(bodyfat$Abdomen), max(bodyfat$Abdomen), length.out = n.newx) y_hat = beta0 + beta1 * new_x # Get lower and upper bounds for mean and pred ymean_lwr = ymean_upr = ypred_lwr = ypred_upr = rep(NA, n.newx) for (i in 1:n.newx){ y_hats = bodyfat.mgibbs$beta %*% matrix(c(1, new_x[i]), 2, 1) ymean_lwr[i] = quantile(y_hats, alpha/2) ymean_upr[i] = quantile(y_hats, 1 - alpha/2) ypred_hats = bodyfat.mgibbs$beta %*% matrix(c(1, new_x[i]), 2, 1) + sapply(1:dim(bodyfat.mgibbs$beta)[1], function(i){rnorm(1, 0, bodyfat.mgibbs$sigma2[i])}) ypred_lwr[i] = quantile(ypred_hats, alpha/2) ypred_upr[i] = quantile(ypred_hats, 1- alpha/2) } output = data.frame(x = new_x, y_hat = y_hat, ymean_lwr = ymean_lwr, ymean_upr = ymean_upr, ypred_lwr = ypred_lwr, ypred_upr = ypred_upr) ``` --- # Lab 7.2 .pull-left[ ```r ggplot(data = bodyfat, aes(x = Abdomen, y = Bodyfat)) + geom_point(color = "blue") + geom_line(data = output, aes(x = new_x, y = y_hat, color = "first"), lty = 1) + geom_line(data = output, aes(x = new_x, y = ymean_lwr, lty = "second")) + geom_line(data = output, aes(x = new_x, y = ymean_upr, lty = "second")) + geom_line(data = output, aes(x = new_x, y = ypred_upr, lty = "third")) + geom_line(data = output, aes(x = new_x, y = ypred_lwr, lty = "third")) + scale_colour_manual(values = c("orange"), labels = "Posterior mean", name = "") + scale_linetype_manual(values = c(2, 3), labels = c("95% CI for mean", "95% CI for predictions"), name = "") + theme_bw() + theme(legend.position = c(1, 0), legend.justification = c(1.5, 0)) + xlab("abdomen circumference (cm)") ``` ] .pull-right[ 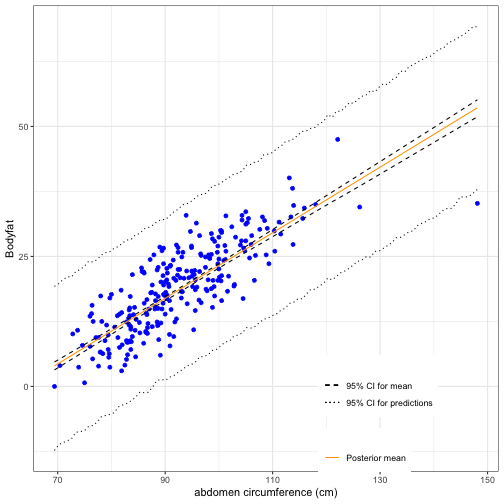<!-- --> ] --- # BMA - More generally, we can use this weighted average formula to obtain the value of a quantity of interest `\(\Delta\)`, `$$p(\Delta | \text { data })=\sum_{j=1}^{2^{p}} p\left(\Delta | M_{j}, \text { data }\right) p\left(M_{j} | \text { data }\right).$$` - We then have `$$E[\Delta | \text { data }]=\sum_{j=1}^{2^p} E\left[\Delta | M_{j}, \operatorname{data}\right] p\left(M_{j} | \text { data }\right).$$` --- # Classification with logistic regression - Response is assumed to be binary. - Example: Spam/Ham. Covariates: symbols, etc. - Logistic regression: `$$p(y_i = 1|x_i) = \frac{\exp(x_i^{'}\beta)}{1 + \exp(x_i^{'}\beta)}.$$` - Likelihood: `$$p(y | X, \beta) = \prod_i^n \frac{(\exp(x_i^{'}\beta))^{y_i}}{1 + \exp(x_i^{'}\beta)}.$$` - Prior: `\(\beta \sim N(0, \tau^2I)\)`. --- # Normal approximation of posterior - Remember MAP? - How to realize normal approximation in R? --- # Bayesian forecasting - The Bayesian paradigm: quantifies uncertainty about: **unknown|known** using a **distribution**. - In forecasting the unknown quantity of interest is `\(y_{T+1}\)`: `$$\begin{aligned} p\left(y_{T+1} | \mathbf{y}\right) &=\int_{\theta} p\left(y_{T+1}, \boldsymbol{\theta} | \mathbf{y}\right) d \boldsymbol{\theta} \\ &=\int_{\theta} p\left(y_{T+1} | \boldsymbol{\theta}, \mathbf{y}\right) p(\boldsymbol{\theta} | \mathbf{y}) d \boldsymbol{\theta} \\ &=E_{\theta | \mathbf{y}}\left[p\left(y_{T+1} | \boldsymbol{\theta}, \mathbf{y}\right)\right] \end{aligned}.$$` - Bayesian forecasting is to **evaluate the posterior expectation**. --- class: inverse, center, middle # All the best!